
![Cover image for [Claude Code #10] A diagnostic guide to /doctor, /context, and /usage](/assets/images/posts/bbb99cc0-928a-48b8-a92b-cab5e3177e7b/claude-code-diagnostics-commands.jpg)
After using an AI agent for a while, certain questions inevitably come up: How full is the context? How much have I used today? Could the configuration be tangled?
Claude Code has diagnostic commands that answer these questions one by one. In this installment, we’ll cover all six together.
If Claude Code Part 9 was about how to put it to work, this time it’s about reading the dashboard.
/context: How full is the context?
/context visualizes current context usage as a colored grid.
Based on Official command documentation, it shows which tools consume the most context. It also indicates whether memory has grown too large and whether a capacity warning has appeared. Add all to expand item-level details.
It is also useful for checking whether CLAUDE.md loaded correctly. If it does not appear in the Memory files list, Claude cannot read that file.
/usage: How much have I used today?
/usage shows token usage, costs, and plan-limit status based on Official cost documentation. Typing /cost opens the same screen.
Use it to estimate how much of your limit you have used on a subscription plan, or how much the session costs when billed through the API. It also shows usage shares by skill and MCP server, making it easier to find what is consuming the limit.
/status: Identify the current session
Entering /status opens the Status tab in the settings screen. You can check the version, model, login account, and connection status in one place.
It is the fastest answer when you wonder, “Which account am I using, and which model?” It runs immediately without interrupting an ongoing response.
/doctor: A configuration health check
/doctor is a comprehensive checkup covering the installation and configuration as a whole (alias: /checkup). It can go as far as fixing the issues it finds.
Its inspection scope is fairly broad.
- Duplicate installations, PATH issues, and corrupted configuration files
- Unused skills, MCP servers, and plugins, along with their context costs
- Slow hooks and whether a new version is available
- Suggestions for trimming an overly long CLAUDE.md (v2.1.206 or later)
It reports findings first and asks for confirmation before making fixes. Outside a session, entering claude doctor outputs read-only diagnostics only. It is worth running about once a month.
/debug: When something goes wrong
If something behaves oddly, enter /debug. From that point on, it enables debug logging and reads the logs to trace the problem.
Adding a description such as “The MCP connection keeps dropping” helps focus the analysis.
/insights: Review your usage patterns
/insights creates an HTML report analyzing recent sessions on this computer.
It highlights how you use Claude across projects, where you often get stuck, and which features are worth trying. Open it occasionally when you want to review your tool-usage habits themselves.

Summary
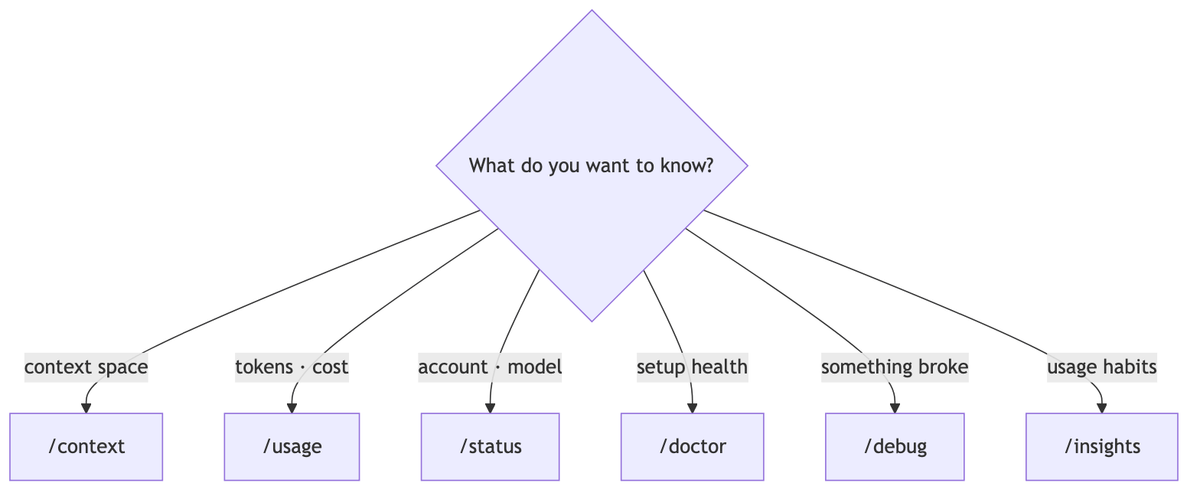
Grouped by situation, the six commands look like this.
- For space, use
/context; for money, use/usage. - For identity, use
/status; for health, use/doctor. - For problems, use
/debug; to review habits, use/insights.
In the next installment, we’ll cover hooks that automatically attach scripts before and after command execution. It’s the first step from diagnostics toward automation.
Sources and verification criteria
- Claude Code official documentation — Commands (Anthropic, checked 2026-08-14)
- Claude Code official documentation — Manage costs effectively (Anthropic, checked 2026-08-14)
Continue reading
Claude Code series
- Previous installment: [Claude Code #2] /plan plan mode: agree on the design before making changes
- Previous installment: [Claude Code #1] /init: Get started by automatically generating CLAUDE.md