
![Cover image for [Modularization #5] Why Xcode Builds Are Slow—and How to Fix Them](/assets/images/posts/6c275447-9dc0-4fd6-9d55-72f98e6a50b4/1.jpg)
Every iOS developer has waited minutes after changing one line of code and pressing Build.
If you build dozens of times a day, cutting one minute from each build gives you over 30 minutes back—no exaggeration.
The core answer: Xcode builds are mainly slow because even small changes trigger recompilation across too large a scope. Modularization directly reduces that scope.
This article breaks down the causes by layer, explains where modularization helps, and shows how to measure the before-and-after results.
Here is the key summary.
- Incremental recompilation is confined to module boundaries. Without modules, the entire app is one unit.
- Do not tune without measurement. Xcode’s Build With Timing Summary is the essential starting tool.
- Also check localized causes such as type-inference bottlenecks and dSYM settings.
Why do Xcode builds get slow?
The causes can be divided into three layers.
First, recompilation scope.
When a Swift file changes, Swift recompiles affected files within its module. In a non-modularized app, however, the entire target is one module.
In a single target with hundreds of thousands of lines, even minor edits trigger broad recompilation. Touch a widely used type, and it is almost a clean build.
Second, type-checking bottlenecks.
The Swift compiler spends substantial time on type inference. A single complex expression can take several seconds. Long chains, complex ternaries, and huge SwiftUI bodies are common culprits.
Third, build settings.
Generating dSYM files in a debug build (DWARF with dSYM File), or incorrectly enabling Whole Module Optimization, adds unnecessary cost to every build.
How does modularization improve build speed?
Modularization improves the first layer: recompilation scope.
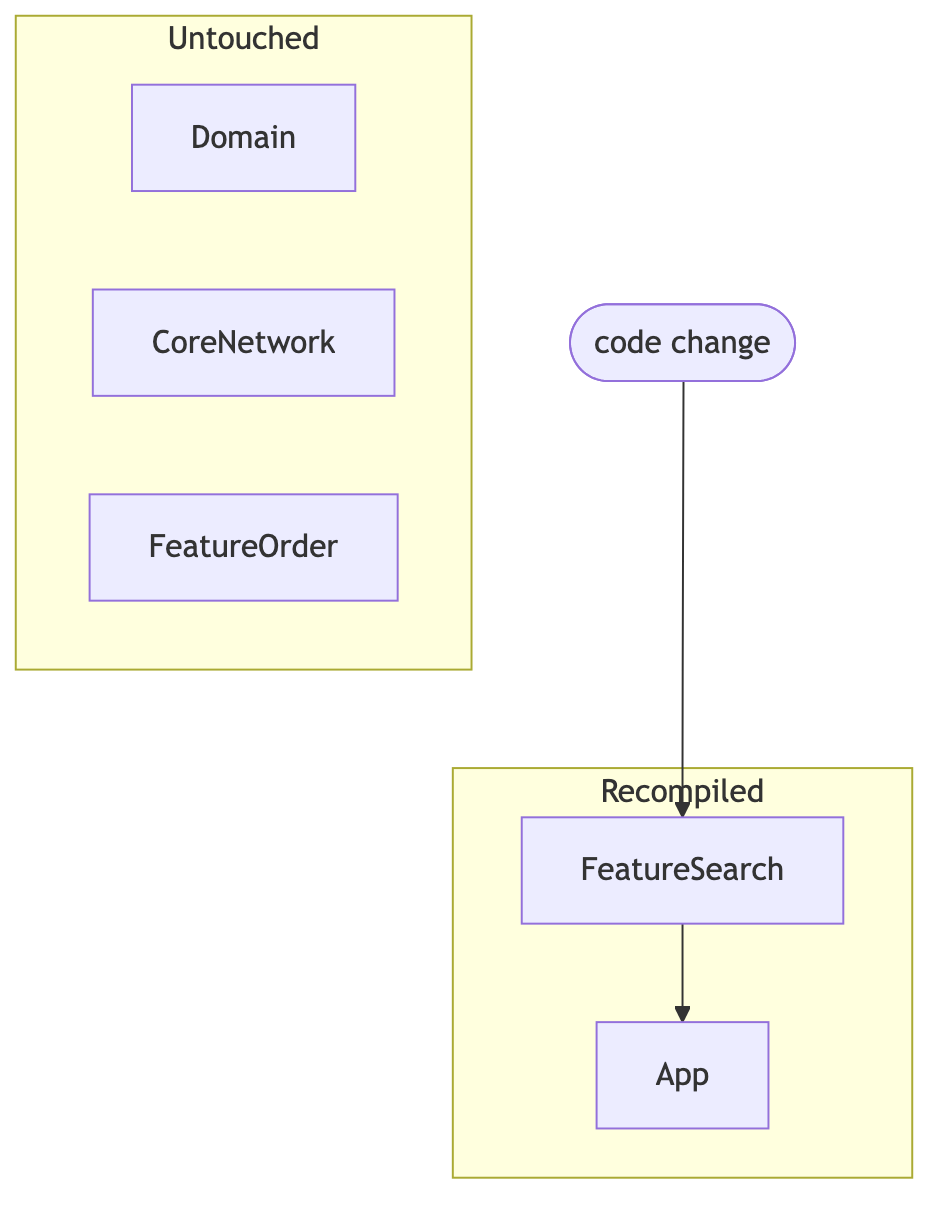
Module boundaries act as recompilation firewalls. If only a module’s internal implementation changes, code outside it does not need recompilation.
The layer structure from the previous article proves useful here.
- Change the internals of the search feature (FeatureSearch), and recompilation is limited to FeatureSearch and roughly the app target.
- Change the public interface of a lower-level module everyone depends on (CoreNetwork), and upper layers are recompiled in sequence.
This leads directly to module-design principles for build speed.
- Place frequently changing code upstream in the graph (Feature), and stable code downstream (Core·Domain).
- Keep downstream modules’ public interfaces minimal (non-public changes have no external impact).
- Do not create an oversized Common module that everyone depends on.
There is also a parallelism benefit. Xcode compiles independent modules simultaneously, so a wider, shallower graph makes clean builds faster too.
How do you measure build time?
Optimization based on intuition usually misses the target. Three tools are enough.
Build With Timing Summary. Run Xcode’s Product → Perform Action → Build With Timing Summary to see phase durations summarized at the end of the build log. Start by identifying the bottleneck target and phase here.
Type-checking warning flags. The compiler identifies slow functions and expressions directly. Add them to Other Swift Flags.
-Xfrontend -warn-long-function-bodies=100
-Xfrontend -warn-long-expression-type-checking=100
// 100ms Warn for functions and expressions exceeding the limit
Build timeline. Open the timeline in the Assistant area of the build log to see parallel execution by target. Long serialized stretches indicate that the dependency graph is blocking parallelism.
What else should you check besides modularization?
Measurement often shows that one build-setting line, rather than modularization, is the problem. Here is a debug-build checklist.
| Item | Recommended setting (Debug) |
|---|---|
| Debug Information Format | DWARF (disable dSYM generation) |
| Compilation Mode | Incremental |
| Optimization Level | -Onone |
| Build Active Architecture Only | Yes |
Starting with Xcode 16, Explicitly Built Modules also improved parallelism during module preparation. Using the latest Xcode can itself improve build speed.
This is how it comes up in interviews
Q. Explain your approach to reducing build times in a large-scale iOS app.
First, measure bottlenecks with Build With Timing Summary and check settings such as debug dSYM generation and compilation mode. Structurally, the key is using modularization to confine recompilation to modules, placing frequently changing code upstream in the dependency graph, and minimizing downstream modules’ public surface area.
Q. If builds remain slow after splitting modules, what would you suspect?
Check whether a shared lower-level module changes frequently and whether its public interface changes often. Use warning flags to find type-checking bottlenecks and break up complex expressions, then inspect the build timeline for a serialized dependency graph blocking parallel compilation.

Build speed is modularization’s most tangible reward, but once modules number in the dozens, project management itself becomes work.
The final article in this series covers Tuist, a tool that lowers that management cost. It also covers escaping pbxproj conflicts and binary caching.